
")
- ΔΙΑΘΕΣΙΜΟΤΗΤΑ: 15-20 Ημέρες
- Κωδικός Προϊόντος: UNC-NMS
- EAN: 4711605286589
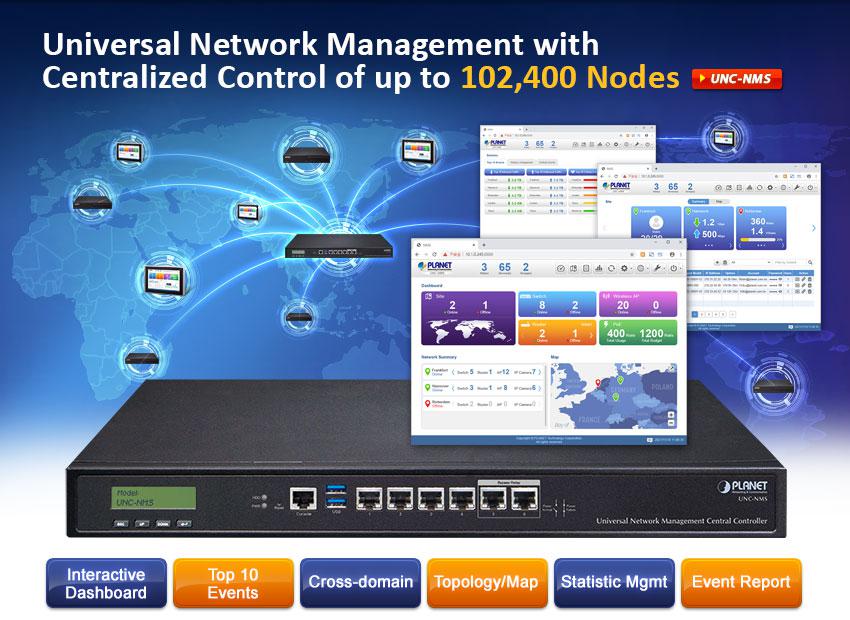
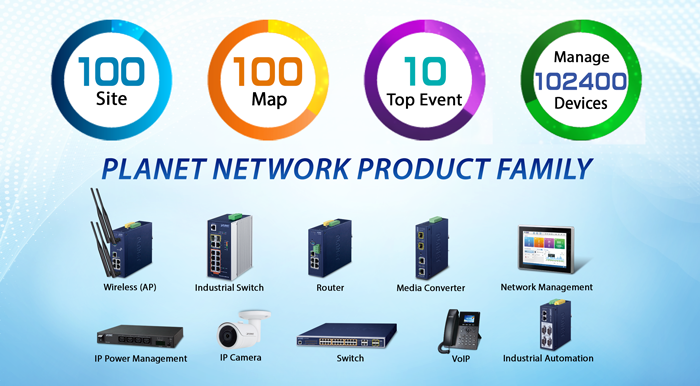
Universal Network Management Central Controller with LCD
PLANET's UNC-NMS Network Management Central Controllers can directly monitor 102,400 nodes by monitoring NMS-500 or NMS-1000V up to 100 sites. However, the deployed devices, such as managed switches, media converters, routers, smart APs, VoIP phones, IP cameras, etc., have to be compliant with the MQTT Protocol, SNMP Protocol, ONVIF Protocol and PLANET Smart Discovery utility. These enable the administrator to centrally manage these nodes from a central office, greatly boosting network and power management efficiency.
PLANET NMS solution features intuitive dashboard, topology and map viewing to make network management efficient and effective.
The exclusive product features for PLANET NMS solution include:
- Centralized control of up to 102,400 nodes
- System upgrade and license (free of charge)
- Intuitive and user-friendly management functions
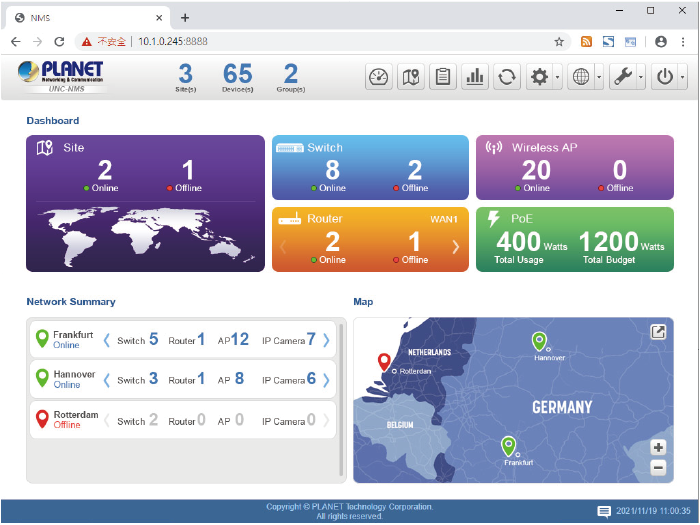
Interactive Dashboard Shows Network Statuses in an Instant
The NMS Controller’s interactive dashboard includes all the managed sites of network routers, switches, access points and PoE statistics. The administrator can quickly overview the status of each device from the Network Summary and Mapping window. Through each dashboard function button, the administrator can quickly link to the detailed current status. The site management page of deployed nodes can be monitored and managed in the VPN network environment. Status on a faulty event or log-in page is also displayed, thus immediately knowing where the disconnection issue comes from.
 |  |
 |  |
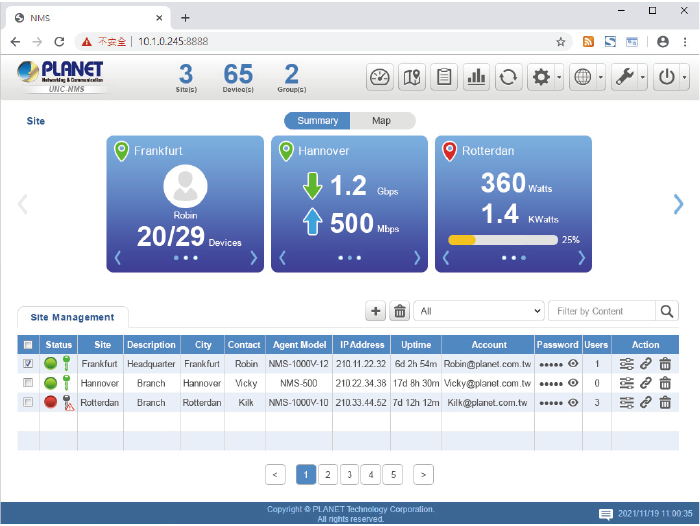
Watch Over Network within Minutes
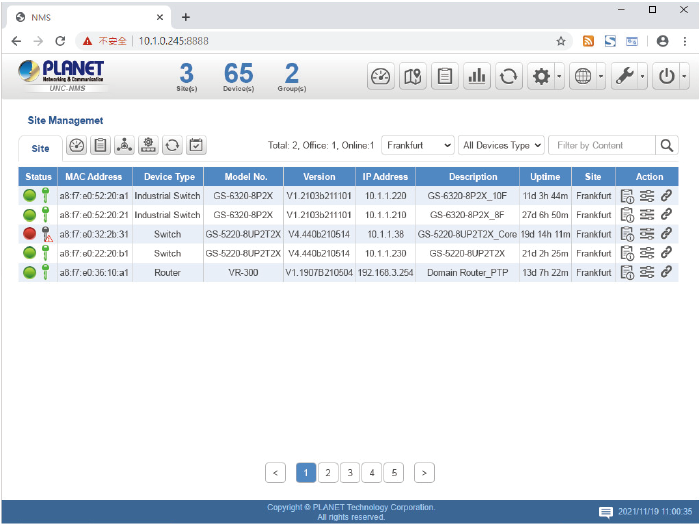
The Device list information web page presents a list of managed devices, an NMS agent dashboard, topology view, AP control, and event and log viewing function. It provides the at-a-glance and efficient summary of your management network. It lets you have a valuable information on the current wired and wireless network statuses via data-driven graphical charts for each site. The topology viewer and event reports enable you to visualize the system usage and node status in real time so as to address whatever issue they may have.
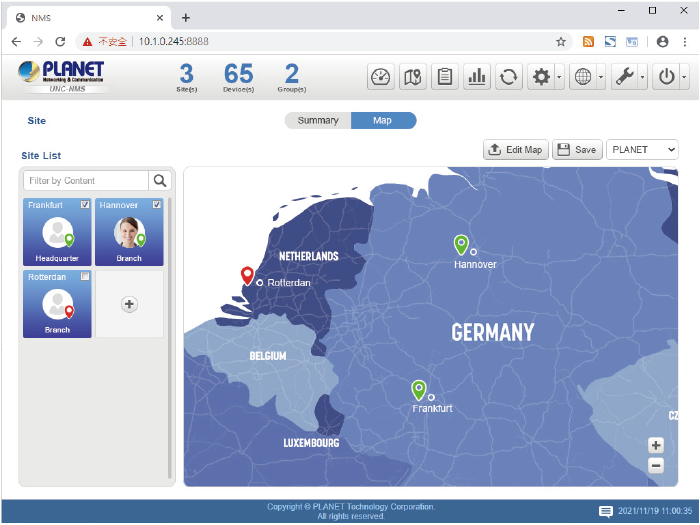
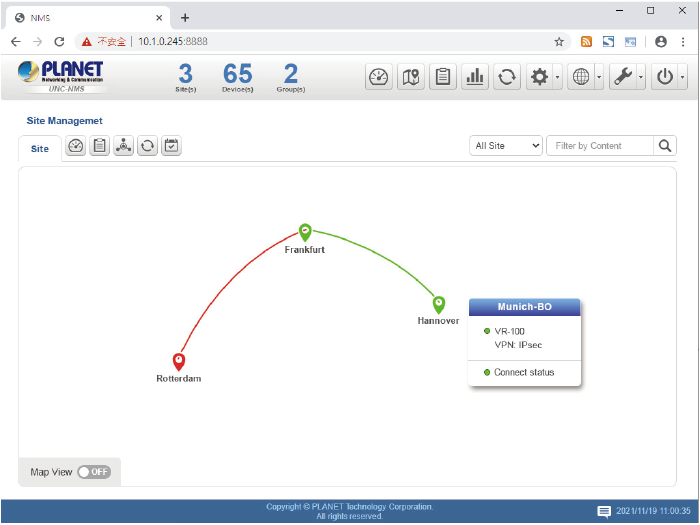
Optimizing Multiple Sites with Topology Viewer (with Maps)
With the site maps, each site can be located according to the map, thus helping the administrator quickly overview the NMS agent and saving time and cost of on-site support and monitoring. The current statuses of NMS agents are shown in real time to optimize the site-to-site VPN network performance. The NMS Center Controller can provide up to 100 sites for all managed NMS agents.
 | 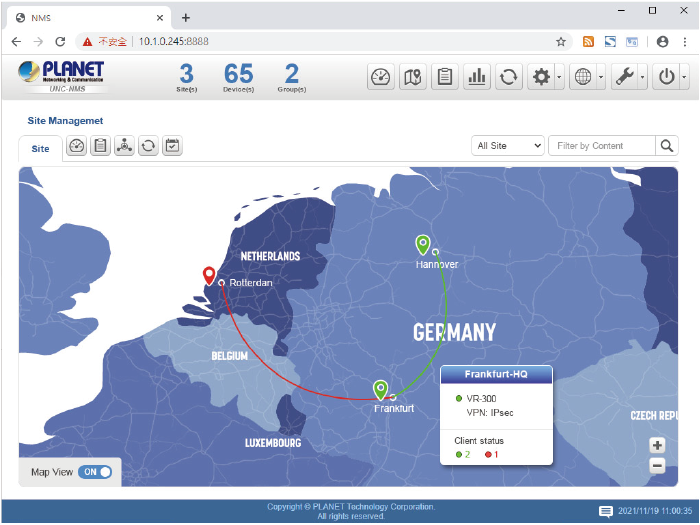 |
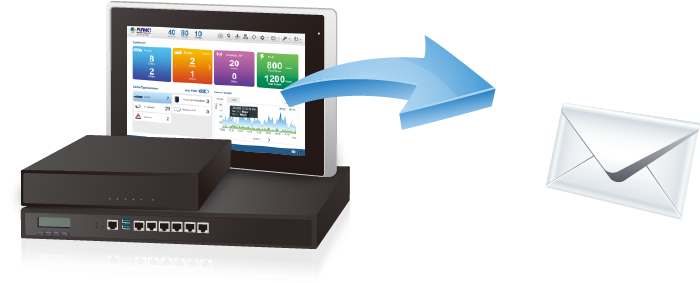
Real-time Centralized Monitoring with E-mail Alarm Function
As the NMS controllers can display a topology view of the deployed powered devices, they can detect which device is online (Green) or offline (Red). The real-time centralized monitoring of these devices can help the administrator know what the current statuses of these devices are. Pop-up alerts shown on the touch panel tell where the problems are. The e-mail alarm function is designed to send an email alert to the administrator via the SMTP server where syslog information can be found once an abnormality is detected. This can prompt the administrator to quickly fix the identified problem in the network.
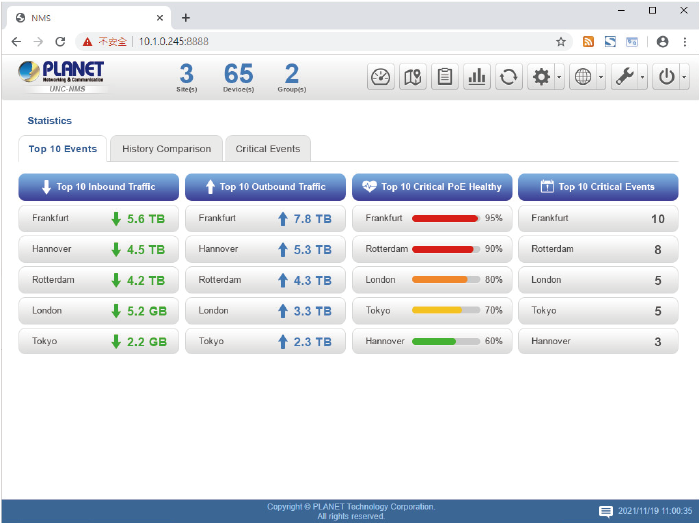
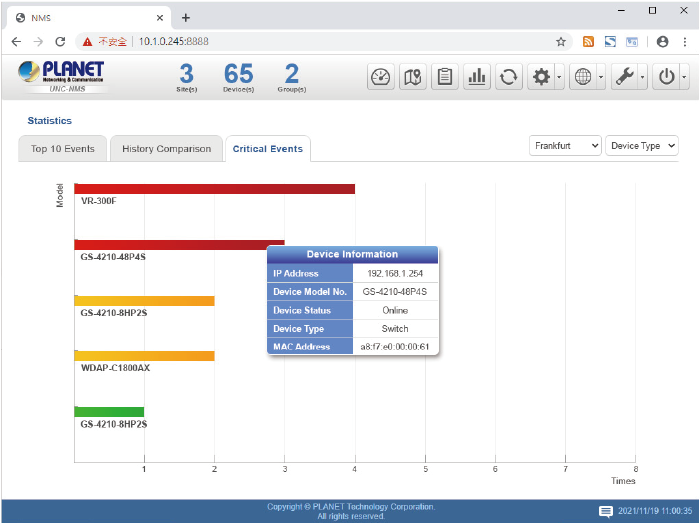
Statistics for Top 10 Events to Manage Network Traffic and PoE Power
The NMS statistic page lists the top 10 inbound and outbound traffic, PoE health, and critical events. It can help administrator to analyze which device is having abnormal power consumption, abnormally high temperature, illegal time of usage, and the near end of life cycle in order to avoid network crash.
 |  |
Power Consumption Analysis and Unloading Management Mechanism
The NMS Controllers provide raw data records for PoE device power usage. Through the history statistics, the administrator can flexibly operate in whatever power is in demand. For energy savings and carbon reduction, the NMS system can help enterprises to save energy by unloading the low priority devices and ensure the safety and stability of electricity consumption in the overall environment of company, factory, etc.
| UNC-NMS | |
| Product | UNC-NMS Universal Network Management Center Central Controller with LCD & 6 10/100/1000T LAN Ports (1024 x 100 nodes) |
| Form Factor | 1U Rack-mount |
| Physical Specifications | |
| I/O Interface | 6 10/100/1000BASE-T Gigabit Ethernet RJ45 ports (LAN 5 and LAN 6 were bypass design) 2 USB 3.0 ports (They cannot be used at the same time.) 1 Factory default button (GPIO) 1 RJ45 Console port interface 2 DB-9 COM1,COM2 (reserve) |
| Storage | 2.5" 64G SATA HDD |
| LED | 2 LED (Power / HDD) |
| LCM Size (Active Area) | 49.45 mm (W) x 9.58 mm (H) |
| LCM Button | 4 touch buttons for enter, exit, up and down |
| Dimensions (W x D x H) | 438 (W) x 180 (D) x 44 mm (H) 17.24” (W) x 7.09” (D) x 1.73” (H) |
| Weight | 3 kg (6.62 lbs) |
| Enclosure | Metal |
| Power Requirements | 3 pin AC Power input socket AC 100~240V , 65W |
| Environment & Certification | |
| Temperature | Operating: 0 ~ 50 degrees C Storage: -20 ~ 70 degrees C |
| Humidity | 5 ~ 90% relative humidity (non-condensing) |
| MTBF (Hours) | 100,000 |
| Network Management | |
| Number of Managed Sites | 100 |
| Number of Managed Devices | 102,400 |
| Auto Discovery by NMS agent | Supports PLANET devices |
| Dashboard | Providing the at-a-glance view of center system, site summary, site Map, traffic, PoE network status |
| Site Management | To create site list, site map for NMS agent management |
| Device List | To manage all site devices or filter one site devices list for NMS agent function operation |
| Statistic | To show Top 10 Event Report, History Comparison function, Critical Events for devices |
| Topology Viewer | A topology of network devices compliant with MQTT, SNMP, ONVIF, Smart Discovery and LLTD Protocol with Map or not |
| Event Reports | The status of a network can be reported via network alarm, system log |
| Alarm System | Email alerts for the administrator via the SMTP server |
| Switch Virtual Panel | To directly configure the switch for basic function |
| ONVIF IP Cam Snapshot | Directly catch the managed IP cam snapshot |
| Batch Provisioning | Enabling multiple APs to be configured and upgraded at one time by using the designated profile for each site. |
| Coverage Heat Map | Real-time signal coverage of APs on the user-defined floor map to optimize Wi-Fi field deployment |
| Customized Profile | Allowing the creation and maintenance of multiple wireless profiles |
| Auto Provisioning | Multi-AP provisioning with one click |
| Cluster Management | Simplifying high-density AP management |
| Zone Plan | Optimizing AP deployment with actual signal coverage |
| Authentication | Built-in RADIUS server seamlessly integrated into the enterprise network |
| User Control | Allowing on-demand account creation and user-defined access policy |
| Scalability | Free system upgrade and AP firmware bulk upgrade capability |
| Network Services | |
| Network | DDNS Supports PLANET DDNS/Easy DDNSDHCP Built-in DHCP Server for auto IP assignment to APsManagement Console; Telnet; SSL; Web browser (Chrome is recommended.); SNMP v1, v2c, v3Discovery Supports SNMP, ONVIF and PLANET Smart Discovery |
| Maintenance | Backup System backup and restore to local or USB HDDReboot Provides system reboot manually or automatically per power scheduleDiagnostic Provides IPv4/IPv6 ping and trace route |
| Standards Conformance | |
| Regulatory Compliance | CE, FCC |
| Standards Compliance | IEEE 802.3 10BASE-T IEEE 802.3u 100BASE-TX IEEE 802.3ab Gigabit 1000BASE-T |


